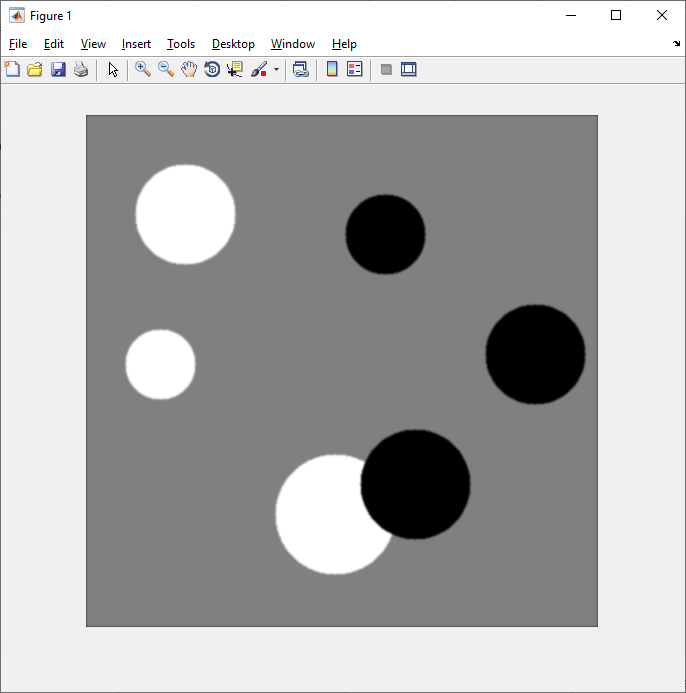
a = imread('circlesBrightDark.png');
bw = a > 200;
imshow(bw)
title('Image with Circles')
stats = regionprops('table',bw,'Centroid','MajorAxisLength','MinorAxisLength','BoundingBox');%,'BoundingBox'
M=stats.BoundingBox;
mask2=M(3,:);
croppedImage = imcrop(bw, mask2);
figure,imshow(croppedImage);title('Cropped Image');
M =
40.5000 215.5000 69.0000 69.0000
50.5000 50.5000 99.0000 99.0000
190.5000 340.5000 115.0000 119.0000


Atau mau seperti ini hasilnya : PAKAI CENTROID
stats =
3×4 table
Centroid BoundingBox MajorAxisLength MinorAxisLength
________________ ____________ _______________ _______________
75 250 [1x4 double] 70.016 70.016
100 100 [1x4 double] 99.924 99.924
242.94 402.67 [1x4 double] 126.23 101.54
a = imread('circlesBrightDark.png');
bw = a > 200;
imshow(bw)
title('Image with Circles')
stats = regionprops('table',bw,'Centroid','MajorAxisLength','MinorAxisLength','BoundingBox');%,'BoundingBox'
centers = stats.Centroid;
diameters = mean([stats.MajorAxisLength stats.MinorAxisLength],2);
radii = diameters/2;
% Plot the circles
hold on
viscircles(centers,radii);
hold off
++++++++++++++++++++++++


RGB = imread('pillsetc.png');
%imshow(RGB)
I = rgb2gray(RGB);
bw = imbinarize(I);%logical
%imshow(bw)
% bw = bwareaopen(bw,30); %logical +NR
% %imshow(bw)
% se = strel('disk',2);
% bw = imclose(bw,se);%logical
%imshow(bw)
bw = imfill(bw,'holes');%logical +Fill
imshow(bw)
stats = regionprops('table',bw,'Centroid','MajorAxisLength','MinorAxisLength','BoundingBox');
M=stats.BoundingBox;
hold on
for k = 1:length(M)
N = M(k,:)
rectangle('Position',N,'FaceColor','r')
end
+++++++++++++++++++++++++++++

RGB = imread('pillsetc.png');
%imshow(RGB)
I = rgb2gray(RGB);
bw = imbinarize(I);%logical
%imshow(bw)
% bw = bwareaopen(bw,30); %logical +NR
% %imshow(bw)
% se = strel('disk',2);
% bw = imclose(bw,se);%logical
%imshow(bw)
bw = imfill(bw,'holes');%logical +Fill
imshow(bw)
%imshow(RGB)
I = rgb2gray(RGB);
bw = imbinarize(I);%logical
%imshow(bw)
% bw = bwareaopen(bw,30); %logical +NR
% %imshow(bw)
% se = strel('disk',2);
% bw = imclose(bw,se);%logical
%imshow(bw)
bw = imfill(bw,'holes');%logical +Fill
imshow(bw)
[B,L] = bwboundaries(bw,'noholes');
imshow(label2rgb(L,@jet,[.5 .5 .5]))
hold on
for k = 1:length(B)
boundary = B{k};
plot(boundary(:,2),boundary(:,1),'w','LineWidth',2);
end
+++++++++++++++++++++++++++++++++++++++++++

stats = regionprops(L,'Area','Centroid');
threshold = 0.94;
for k = 1:length(B)
% obtain (X,Y) boundary coordinates corresponding to label 'k'
boundary = B{k};
% compute a simple estimate of the object's perimeter
delta_sq = diff(boundary).^2;
perimeter = sum(sqrt(sum(delta_sq,2)));
% obtain the area calculation corresponding to label 'k'
area = stats(k).Area;
% compute the roundness metric
metric = 4*pi*area/perimeter^2;
% display the results
metric_string = sprintf('%2.2f',metric);
% mark objects above the threshold with a black circle
if metric > threshold
centroid = stats(k).Centroid;
plot(centroid(1),centroid(2),'ko');
end
text(boundary(1,2)-35,boundary(1,1)+13,metric_string,'Color','y','FontSize',14,'FontWeight','bold')
end
title(['Metrics closer to 1 indicate that ', 'the object is approximately round'])
Tidak ada komentar:
Posting Komentar